What FactIQ users actually want
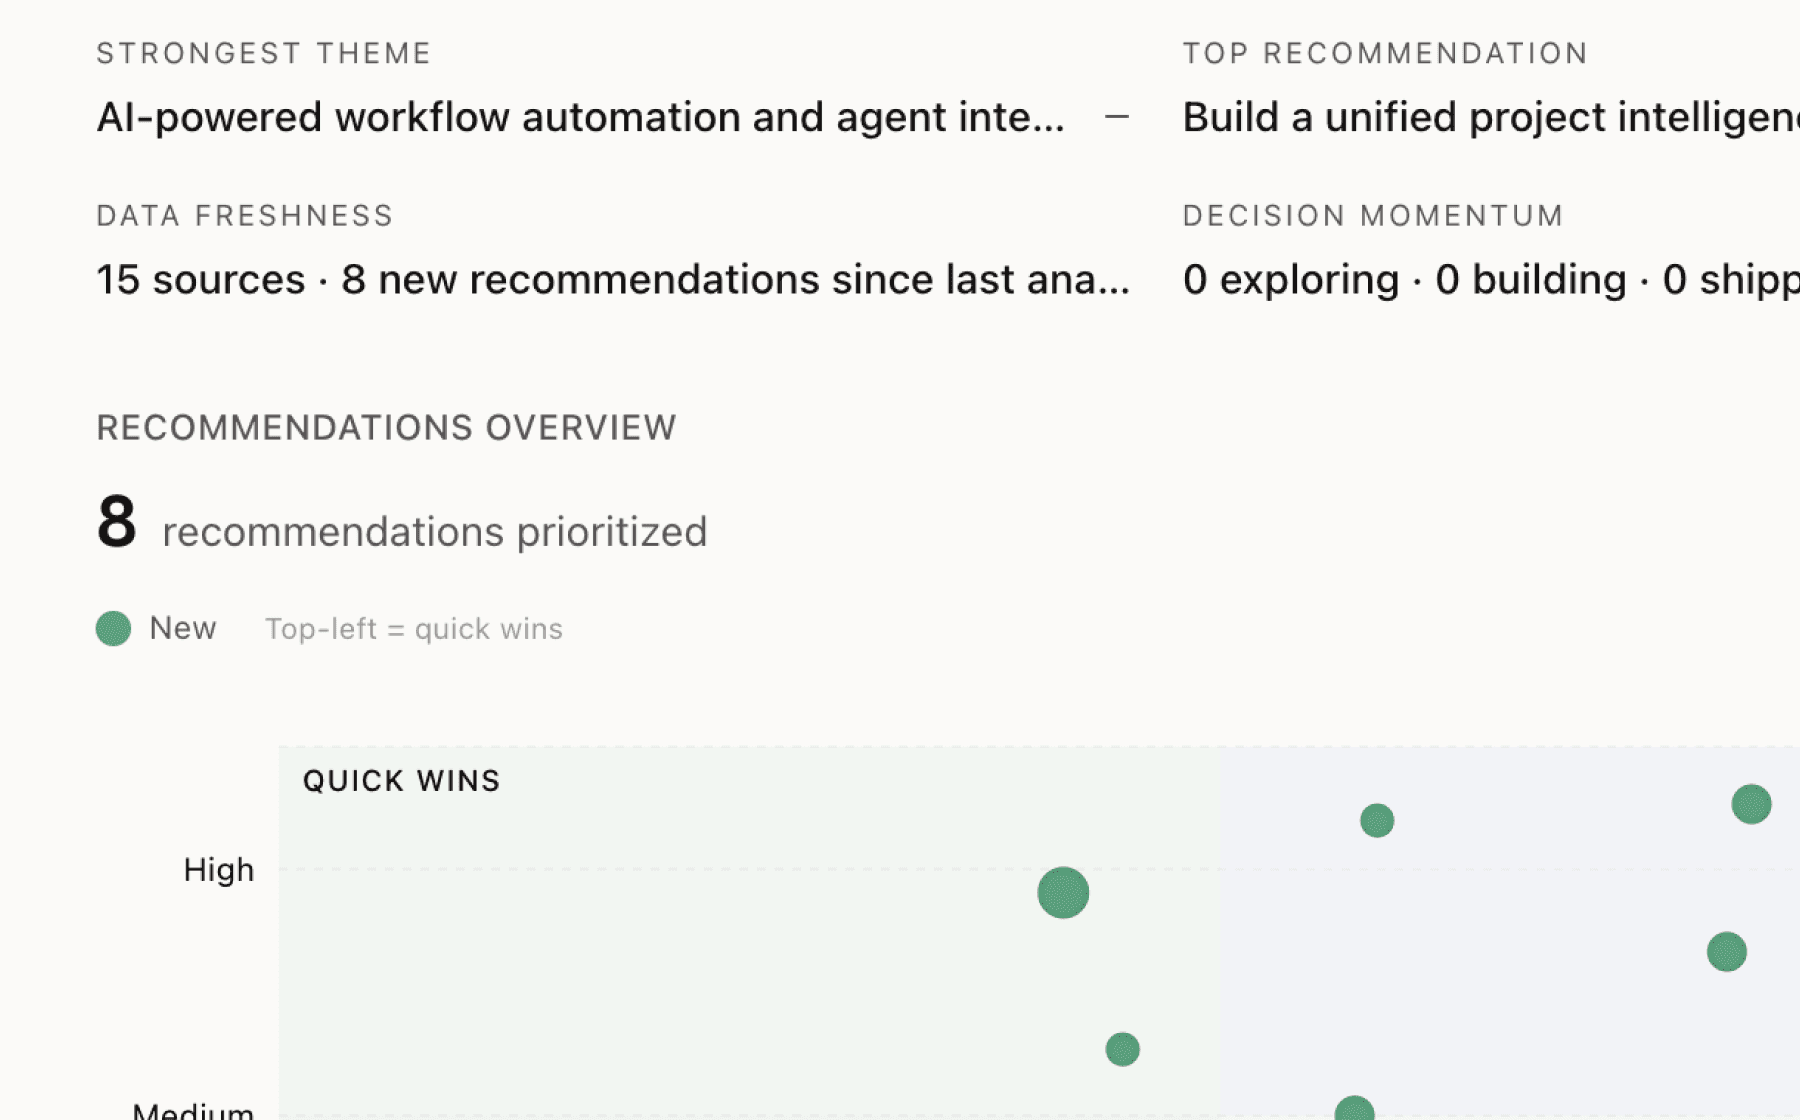
Mimir analyzed 12 public sources — app reviews, Reddit threads, forum posts — and surfaced 15 patterns with 7 actionable recommendations.
This is a preview. Mimir does this with your customer interviews, support tickets, and analytics in under 60 seconds.
Top recommendation
AI-generated, ranked by impact and evidence strength
Build a 30-second activation flow that shows concrete value before requiring account creation
High impact · Medium effort
Rationale
The platform solves a 90-minute problem but users don't experience relief until after they've committed to signing up. New visitors land on educational content about the problem space rather than immediately experiencing the solution. Research shows analysts spend most of their time on mechanical tasks like finding and downloading data, yet the current entry point delays demonstration of how FactIQ eliminates that friction.
Allow users to run one natural language query and see instant results with transparent methodology before creating an account. This transforms abstract positioning into tangible proof. The free tier already provides 20 monthly reports, so letting unregistered users experience one query costs nothing in revenue while dramatically increasing conversion likelihood.
The founding team's consultative approach through 30-minute demos indicates current activation relies on high-touch sales rather than product-led growth. Self-serve activation that demonstrates value immediately would reduce dependence on scheduled calls while preserving them for enterprise prospects.
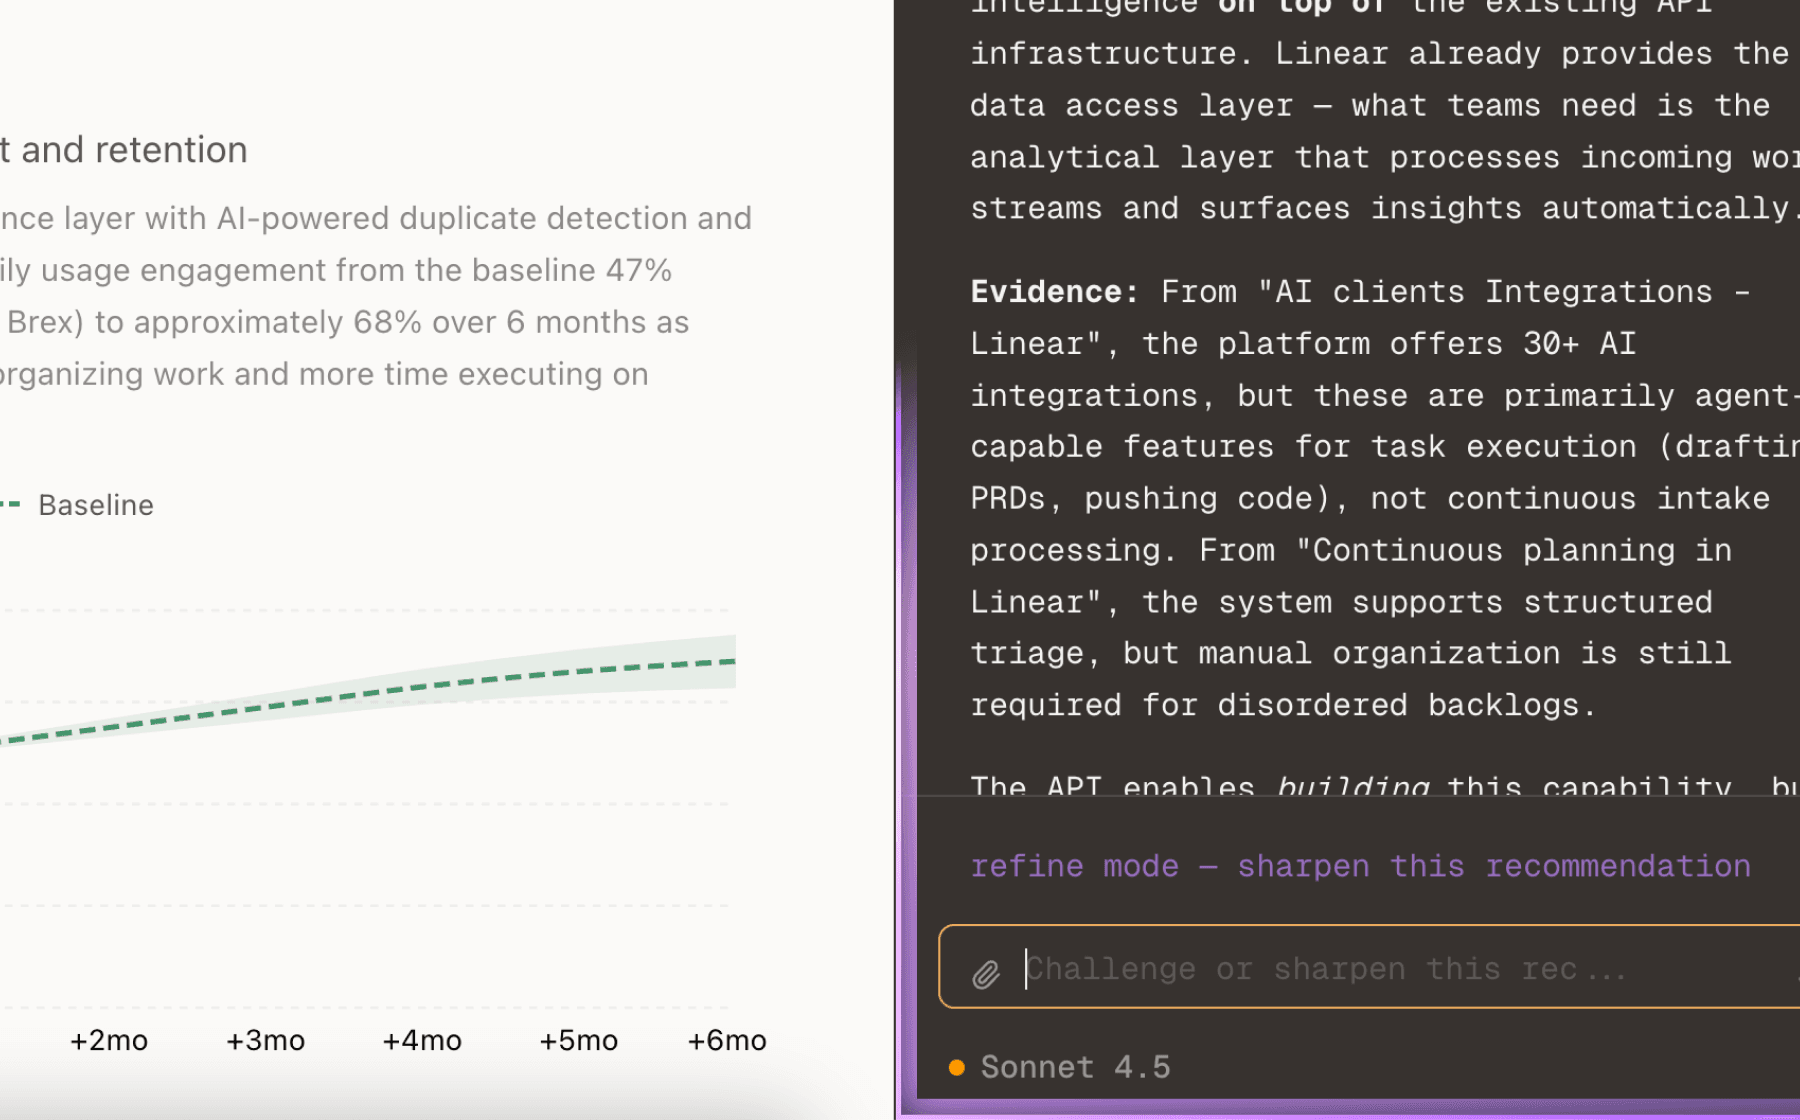
Projected impact
The full product behind this analysis
Mimir doesn't just analyze — it's a complete product management workflow from feedback to shipped feature.
Evidence-backed insights
Every insight traces back to real customer signals. No hunches, no guesses.
Chat with your data
Ask follow-up questions, refine recommendations, and capture business context through natural conversation.
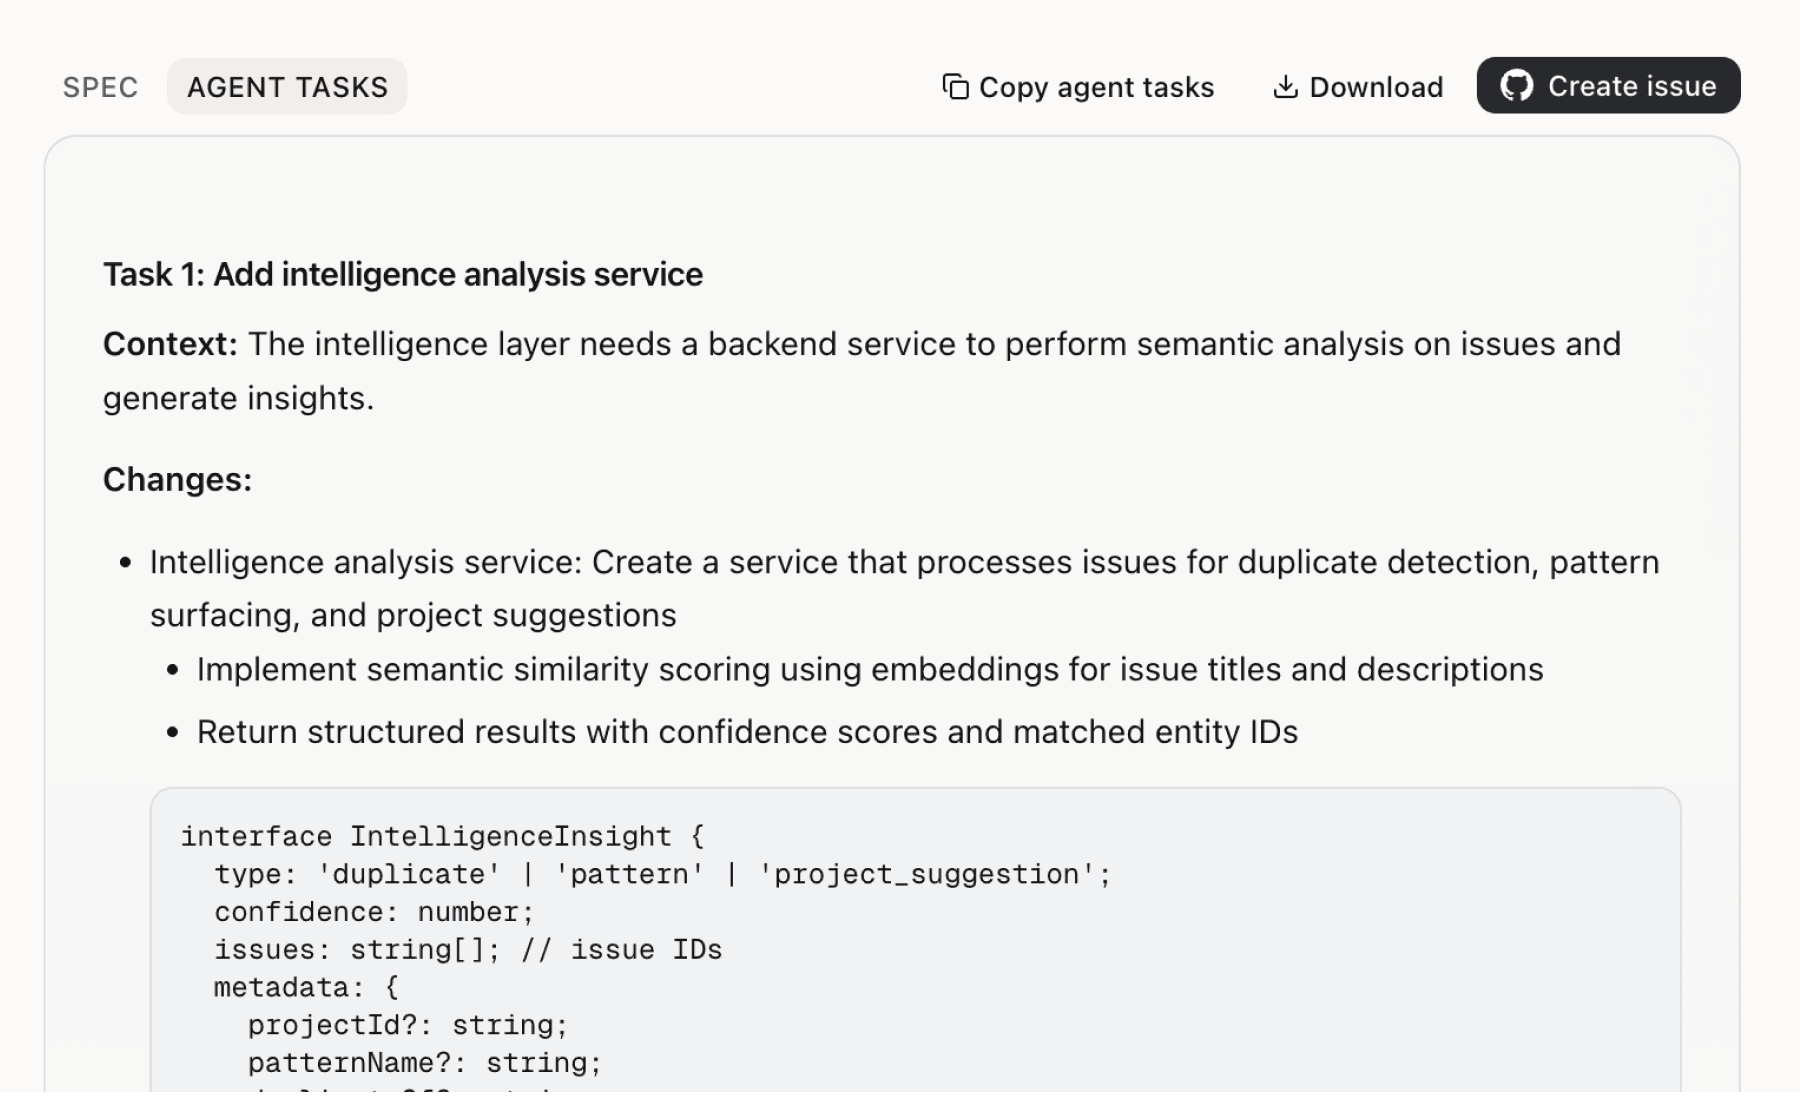
Specs your agents can ship
Go from insight to implementation spec to code-ready tasks in one click.
This analysis used public data only. Imagine what Mimir finds with your customer interviews and product analytics.
Try with your dataMore recommendations
6 additional recommendations generated from the same analysis
The platform serves three distinct user segments with different needs and contexts, but presents a single generic experience. A journalist investigating unemployment trends has different workflows and success metrics than a product manager analyzing software sector growth or a policy analyst evaluating regional economic patterns. Research identifies these three groups as primary users but the current positioning doesn't speak directly to any of them.
The platform emphasizes transparent methodology through citations and step-by-step reasoning, but this differentiator may not be immediately visible to new users evaluating trustworthiness. Analysts using economic data for business decisions need confidence in the underlying sources and calculations, especially when the platform positions data as 'as is' with user responsibility for validation.
The enterprise tier emphasizes collaboration as a premium feature starting at $30k annually, but research provides no evidence that teams can currently share queries, annotate findings, or build organizational knowledge bases. Product managers and analysts typically work in cross-functional teams where research findings need distribution and reuse, yet the platform appears designed for individual contributors.
Users come to FactIQ with specific questions but economic data is released on regular schedules. A journalist tracking employment trends would benefit from automatic alerts when new BLS jobs data drops, while a product manager monitoring software sector productivity would want notifications about relevant Census releases. The platform aggregates 7.4 million data series but provides no evidence of proactive delivery mechanisms.
The platform provides access to 7.4 million data series but users face discovery challenges even within a unified interface. A founder analyzing software sector economics doesn't want to search through millions of series — they want a curated view of software publishing revenue, employment, productivity, and related metrics. The research on software productivity gains demonstrates how specific industry narratives drive engagement, yet users must still construct these views themselves.
Users query economic data to inform decisions and communicate insights to stakeholders, but the platform appears focused on analysis rather than presentation. Custom chart styling exists only in the $30k enterprise tier, yet all users need to present findings effectively. A product manager explaining competitive positioning or a journalist writing about employment trends needs more than raw visualizations.
Insights
Themes and patterns synthesized from customer feedback
Software publisher revenue per employee surged 28% since ChatGPT launch (2023-2025) despite flat headcount, indicating strong product-market conditions for AI-powered data analysis tools. This market context validates the demand for platforms that reduce mechanical data work.
“Software Publishers' revenue per employee rose 28% since ChatGPT's public launch, significantly higher than other industries”
Privacy-friendly event analytics without cookies or personal data storage/sale, combined with optional account fields, reduces friction while respecting user privacy. Transparent data handling practices align with analyst expectations for responsible platforms.
“FactIQ collects usage data from user interactions with datasets, reports, and visualizations to personalize recommendations and improve product quality”
Founding team previously built Defog.ai, created open-source LLMs for data analysis, and worked with Fortune 500 companies on AI solutions, establishing domain expertise. Direct founder support and personalized onboarding further establish trust.
“Founded by team that previously built Defog.ai for 3 years, created open-source LLMs for data analysis, and worked with Fortune 500 companies (Toyota, Genmab, AllianceBernstein) on AI-powered data...”
Plans to add China, India, and EU economic data sources beyond current US coverage expand the total market opportunity and deepen user research capabilities. This positions the platform for scaling beyond domestic analyst base.
“FactIQ is expanding beyond US economic data to include China, India, and EU data sources”
Flexible sign-up options (Google OAuth, email), account recovery mechanisms, and multiple contact channels (email, social, scheduled demos) lower barriers to onboarding. Accessible founder support establishes consultative tone.
“Sign-up flow offers both Google OAuth and email-based registration options”
Showcasing current examples like egg prices and employment data with recent update timestamps demonstrates platform responsiveness and data freshness to potential users.
“Live example charts show egg prices (updated Dec 1, 2025) and nonfarm employment data (Jan 1939-Dec 2025)”
Unilateral update rights with continued-use acceptance establish legal flexibility for product iteration and policy changes as the platform scales.
“Terms can be updated unilaterally by FactIQ; continued use constitutes acceptance of changes”
FactIQ positions data as 'as is' with capped liability ($100 or amount paid) and places validation responsibility on users before business decisions. This legal structure protects the platform while being transparent about data confidence limits.
“Data is provided on 'as is' and 'as available' basis with no warranty of accuracy, completeness, or uninterrupted service”
The $30k/year minimum enterprise plan includes custom branding, priority support, training, and product roadmap influence to serve high-value team customers. Premium feature differentiation (chart styling, roadmap access) increases retention and justifies tier separation.
“Enterprise plan priced at $30k/yr minimum with custom branding, priority support, collaboration, and product roadmap influence”
CSV export, shareable interactive charts, and enterprise collaboration features enable team-based analysis and reporting. Built-in transparency showing data series and transformations used improves context when sharing findings externally.
“Export data as CSV and share interactive charts via links for reports, memos, and stories”
The platform automatically handles nominal vs. real terms, percentage changes, and raw value conversions without manual intervention. This prevents errors and reduces the mechanical data preparation work that currently consumes analyst time.
“Users must manually check whether data series are in nominal vs real terms”
FactIQ aggregates millions of official US economic data series from five government sources into a single searchable platform, directly eliminating the 90+ minutes analysts currently spend navigating fragmented portals and cryptic identifiers. This core integration removes the primary mechanical barrier that keeps users from actual analysis work.
“FactIQ aggregates 7.4 million data series from official US government sources including BLS, Census, BEA, EIA, USDA, and DOT”
Historical high barriers (expensive enterprise terminals for large institutions only) are removed, making authoritative US economic data accessible to researchers, journalists, and business professionals. The freemium model with 20 monthly reports and unlimited search access further lowers activation barriers.
“High-quality economic data has been accessible only to large institutions with expensive terminals, excluding researchers, journalists, and business professionals”
FactIQ leverages AI to answer complex economic questions while maintaining methodological transparency through citations, source attribution, and step-by-step reasoning. This shifts user effort from mechanical data work to higher-value analysis and decision-making.
“AI Analyst feature allows users to ask complex questions and see methodology steps and sources with follow-up capabilities”
Plain-English queries replace the need to memorize series IDs, taxonomies, and codebooks, directly addressing the 90-minute time sink from BLS portal navigation. This democratizes access for users without specialized technical expertise while freeing experienced analysts to focus on insight generation rather than data mechanics.
“Analysts spend ~90 minutes wrestling with BLS series IDs and navigating data portals instead of focusing on analysis”
Run this analysis on your own data
Upload feedback, interviews, or metrics. Get results like these in under 60 seconds.