What Culdesac users actually want
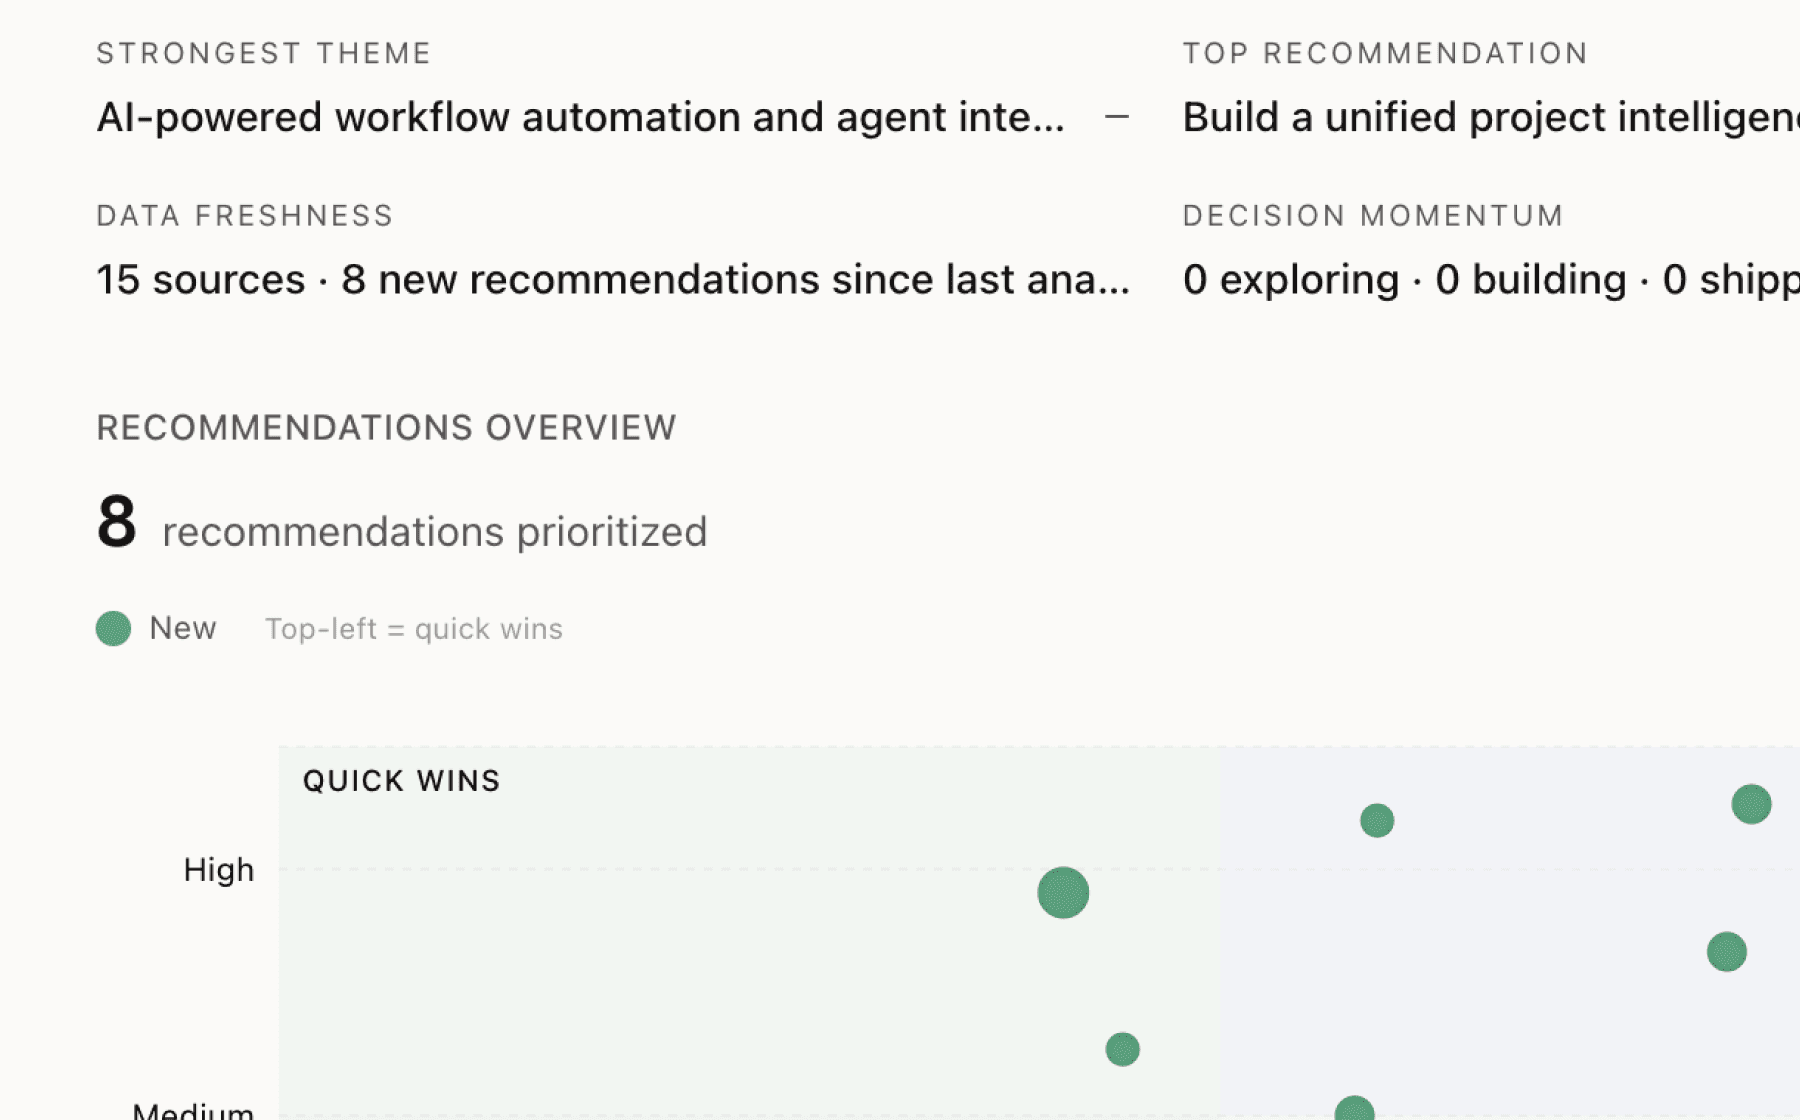
Mimir analyzed 11 public sources — app reviews, Reddit threads, forum posts — and surfaced 14 patterns with 7 actionable recommendations.
This is a preview. Mimir does this with your customer interviews, support tickets, and analytics in under 60 seconds.
Top recommendation
AI-generated, ranked by impact and evidence strength
Build a mobility value calculator that quantifies transportation savings for prospective residents
High impact · Small effort
Rationale
The $3,000 annual mobility package represents a substantial financial benefit, yet this value proposition appears buried in FAQs rather than front and center in the marketing experience. Prospective residents need to viscerally understand the economic trade-off between car ownership costs (insurance, payments, parking, gas, maintenance) and Culdesac's comprehensive mobility ecosystem.
A calculator that asks users about their current transportation spending and compares it against the included mobility package (unlimited Valley Metro passes, Envoy carshare, Lyft credits, Waymo access, bike storage) would transform an abstract benefit into concrete monthly savings. This directly supports the user acquisition funnel and helps product managers, founders, and engineering leads understand how to communicate differentiation.
The mobility package is the clearest manifestation of the car-free value proposition with quantifiable impact. Making this calculable and shareable would strengthen retention by reinforcing the financial wisdom of the lifestyle choice every time residents use a benefit.
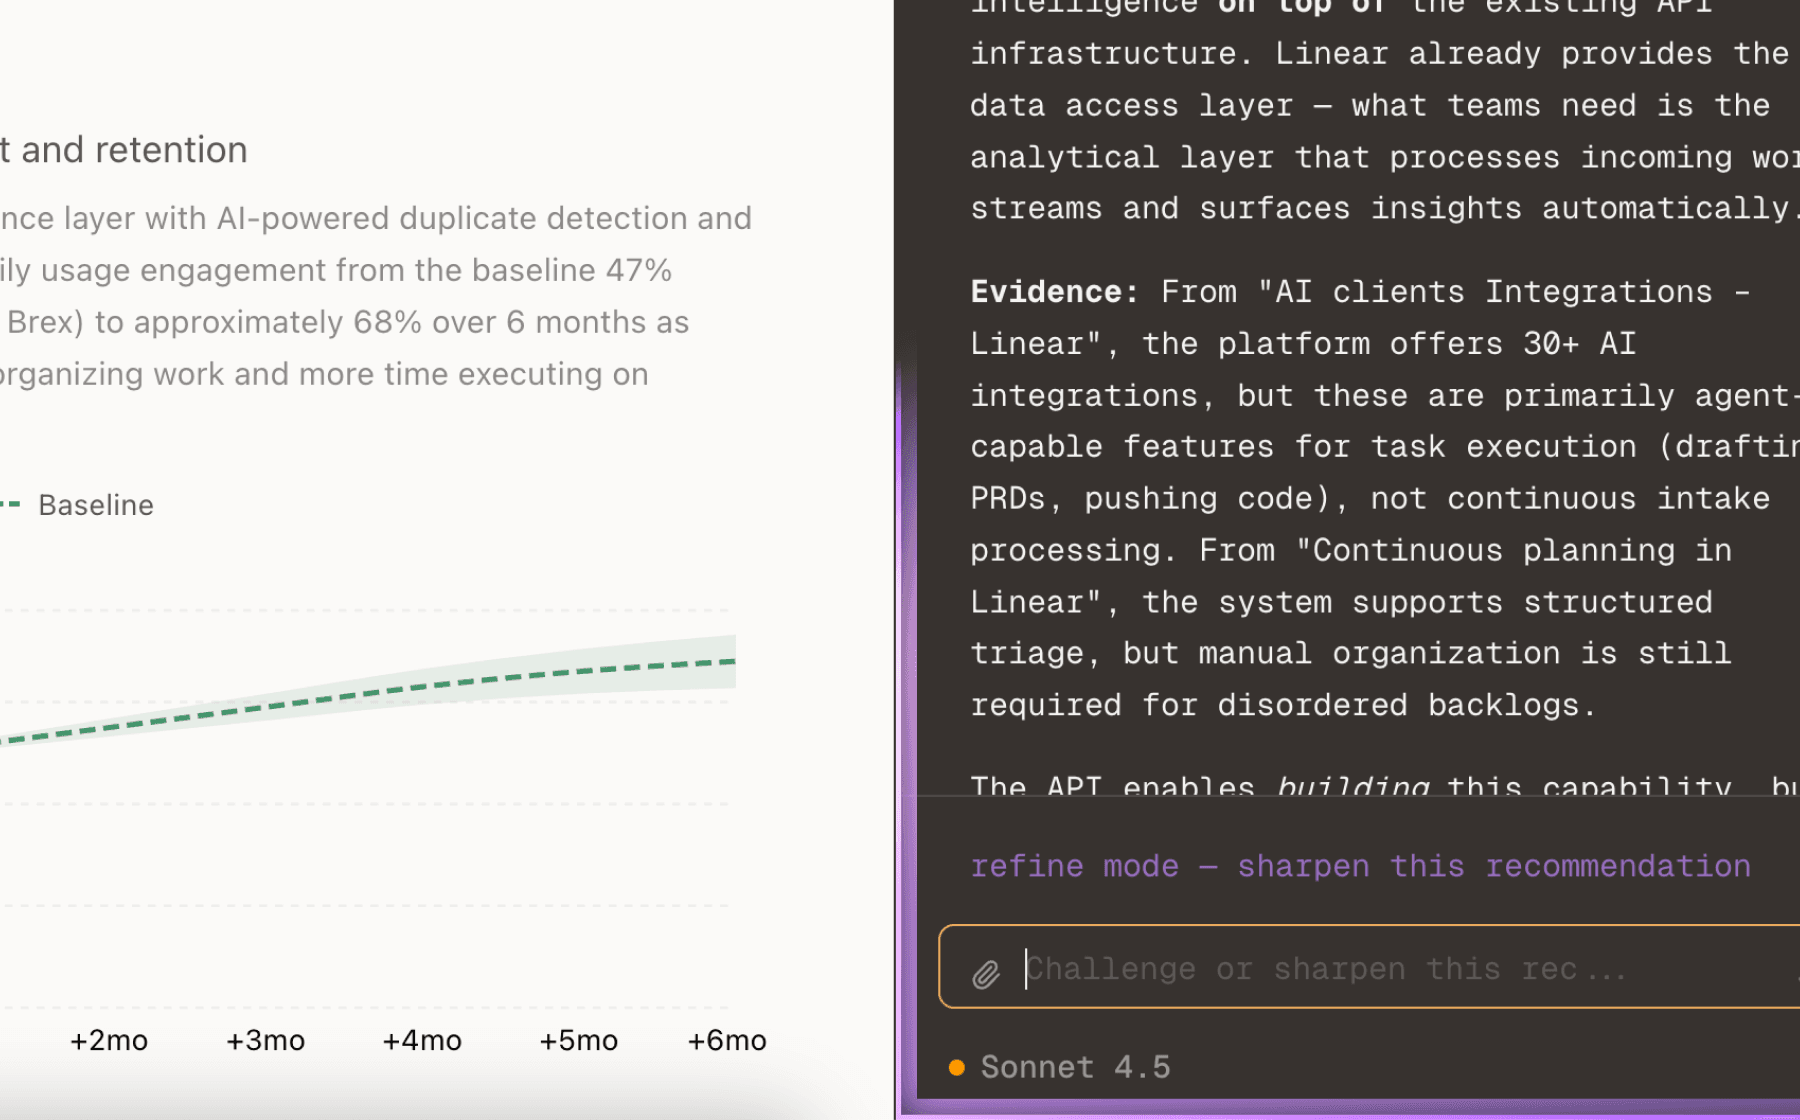
Projected impact
The full product behind this analysis
Mimir doesn't just analyze — it's a complete product management workflow from feedback to shipped feature.
Evidence-backed insights
Every insight traces back to real customer signals. No hunches, no guesses.
Chat with your data
Ask follow-up questions, refine recommendations, and capture business context through natural conversation.
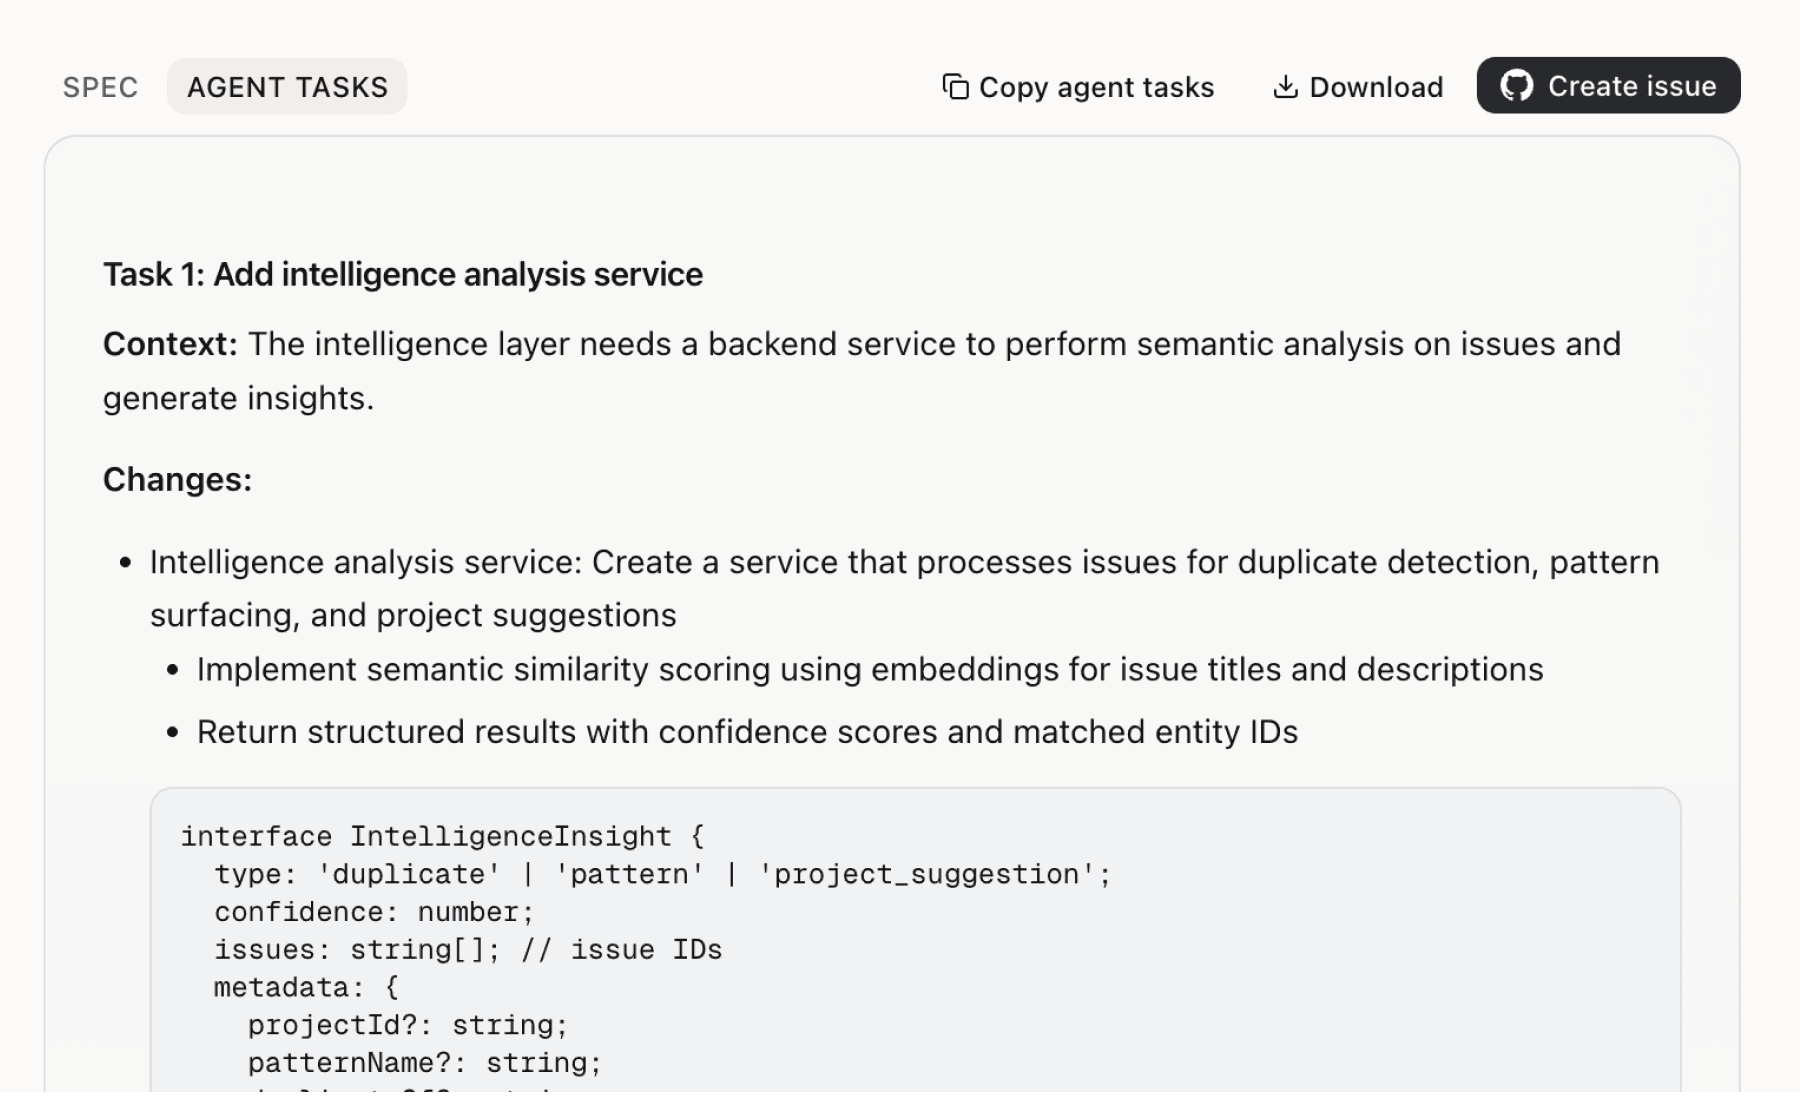
Specs your agents can ship
Go from insight to implementation spec to code-ready tasks in one click.
This analysis used public data only. Imagine what Mimir finds with your customer interviews and product analytics.
Try with your dataMore recommendations
6 additional recommendations generated from the same analysis
Regular programming generates 34 documented events and recurring Second Saturday markets, yet there's no visible system connecting residents across developments or showcasing the vibrancy of community life. Product managers and engineering leads need data on what's working, and residents need reasons to stay engaged between major events.
Residents have access to a complex ecosystem of mobility options (Valley Metro, Envoy, Lyft, Waymo, Bird), on-site businesses (Cocina Chiwas, Busan Mart, Archer's Bikes), and amenities, but there's no unified interface for discovery and booking. The mobility concierge exists to answer questions, indicating residents struggle to navigate the fragmented experience.
Culdesac is actively recruiting partners for expansion and has multiple projects in development (Murphy Crossing, future sites), yet prospective residents have no way to express interest in specific locations or connect with the community before move-in. The 56% millennial preference and 46% baby boomer preference for walkable neighborhoods represents massive latent demand with no channel to capture it.
The four-week free rent promotion shows Culdesac uses incentives to drive leasing, but there's no evidence of structured resident referrals despite community connection being a core value. Residents who embrace the car-free lifestyle become evangelists, yet there's no formal channel to convert their enthusiasm into acquisition.
The evidence cites urban sprawl reducing community connection and normalizing hour-long commutes, but there's no visible measurement showing Culdesac residents how their lifestyle choices create different outcomes. Product managers and founders would benefit from seeing concrete data on the impact of car-free design.
Murphy Crossing includes income-restricted units with complex qualification tables (80%, 100%, 120% AMI by household size), yet this information appears fragmented across documents rather than in a clear, accessible format. Ensuring walkable communities remain accessible across income levels is stated as important, but the path to qualification is opaque.
Insights
Themes and patterns synthesized from customer feedback
Pet-friendly design, recreational facilities (gym, pool, dog park), in-unit amenities (washer/dryer), and shared courtyards enhance daily quality of life and community belonging, though these are secondary to core walkability and transit value.
“All units are pet-friendly with shared courtyards featuring BBQ grills, water features, fire pits, and hammocks”
Leadership team brings domain expertise from real estate development, technology, urban planning, and large-scale operations (Opendoor, Bain, MTA, McKinsey, Google), positioning the company to scale walkable community development effectively across multiple markets.
“Leadership team includes experienced professionals from Opendoor, Bain Capital, NYC MTA, real estate development ($4.5B+ projects), McKinsey, Apple, Google, and Carvana”
Technology touchpoints including app-based utilities, floor plan exploration, retail information, and mobility concierge services support resident engagement and reduce friction in car-free living. Secondary to physical design but enables adoption.
“Base rent does not include utilities; residents pay additional utility costs through Culdesac app with rent.”
Marketing frames the company as solving urban sprawl and commute fatigue through a technology, real estate, and culture blend, appealing to forward-thinking residents and stakeholders seeking alternatives to car-dependent living.
“Life where everything connects”
Daily fluctuations in unit pricing and availability require resident contact with sales or joining waitlists, creating conversion and retention friction that reduces user engagement with the product.
“Pricing and unit availability change daily due to demand, requiring residents to contact or join waitlist for up-to-date information.”
Core mission addresses carbon emissions from vehicle ownership and improves resident well-being through walkable design, creating alignment with sustainability goals and quality-of-life expectations that resonate with target users.
“Private vehicle ownership is the largest source of carbon emission pollution in cities”
Selection of communities in bike-friendly cities with favorable climates (e.g., Tempe's 300 days of sunshine) and strong existing food scenes maximizes walkability appeal and neighborhood integration benefits.
“Located in Tempe, Arizona—most bike-friendly city in 5-million person Phoenix metro with 300 days of sunshine and diverse food scene.”
Regular programming (Second Saturday markets, monthly events) and permanent shared spaces (courtyards, paseos, plazas, parklets) intentionally drive neighbor connections and sustained resident engagement. These physical and social infrastructures directly impact retention.
“Events are marketed as 'Open to All', indicating inclusive community engagement strategy to drive foot traffic and resident/visitor engagement”
Data confirms 56% of millennials prefer walkable neighborhoods, baby boomers show strong demand, and Culdesac claims first truly walkable U.S. neighborhood built from scratch. Expansion trajectory and high-profile endorsements from urbanists validate product-market fit and growth opportunity.
“46% of baby boomers prefer to live in walkable, mixed-use neighborhoods”
Curated on-site and nearby retail/restaurants (Cocina Chiwas, Busan Mart) integrated into neighborhoods create vibrant commercial environments and support local entrepreneurs. Local business presence is tracked as a community engagement metric and differentiator.
“Number of local businesses and shops available within the community”
Ensuring walkable communities remain accessible across income levels and ability status through pricing strategies, income qualifications, and ADA compliance. Broadens addressable market and aligns with community-building mission.
“All shared and public spaces are ADA-accessible with ground-floor and elevator-accessible ADA units available.”
Company is actively recruiting investors, landowners, and government partners to replicate the model across multiple developments (Culdesac Tempe, Murphy Crossing, future projects). Expansion capability is critical to growing user base and engagement metrics at scale.
“Seeking partnerships with landowners, investors, government entities, and community organizers to scale car-free city developments”
Zero-parking, transit-connected neighborhoods positioned on light rail hubs with complimentary passes, carshare, and micro-mobility partnerships (Lyft, Bird, Waymo) are the foundational differentiator enabling walkability. This directly addresses the company's core mission and is the primary reason users select these communities.
“Unlimited free rides on Valley Metro transit as a resident benefit”
Pedestrian-scaled physical environments combining residential, retail, and gathering spaces with bike infrastructure, wide paseos, and nearby local businesses within biking distance. This design creates daily engagement touchpoints and sense of belonging that drive retention metrics.
“First walkable community of its kind — embracing a culture of belonging, transportation freedom, and thriving local businesses.”
Run this analysis on your own data
Upload feedback, interviews, or metrics. Get results like these in under 60 seconds.