What Condor Energy users actually want
Mimir analyzed 1 public source — app reviews, Reddit threads, forum posts — and surfaced 4 patterns with 6 actionable recommendations.
This is a preview. Mimir does this with your customer interviews, support tickets, and analytics in under 60 seconds.
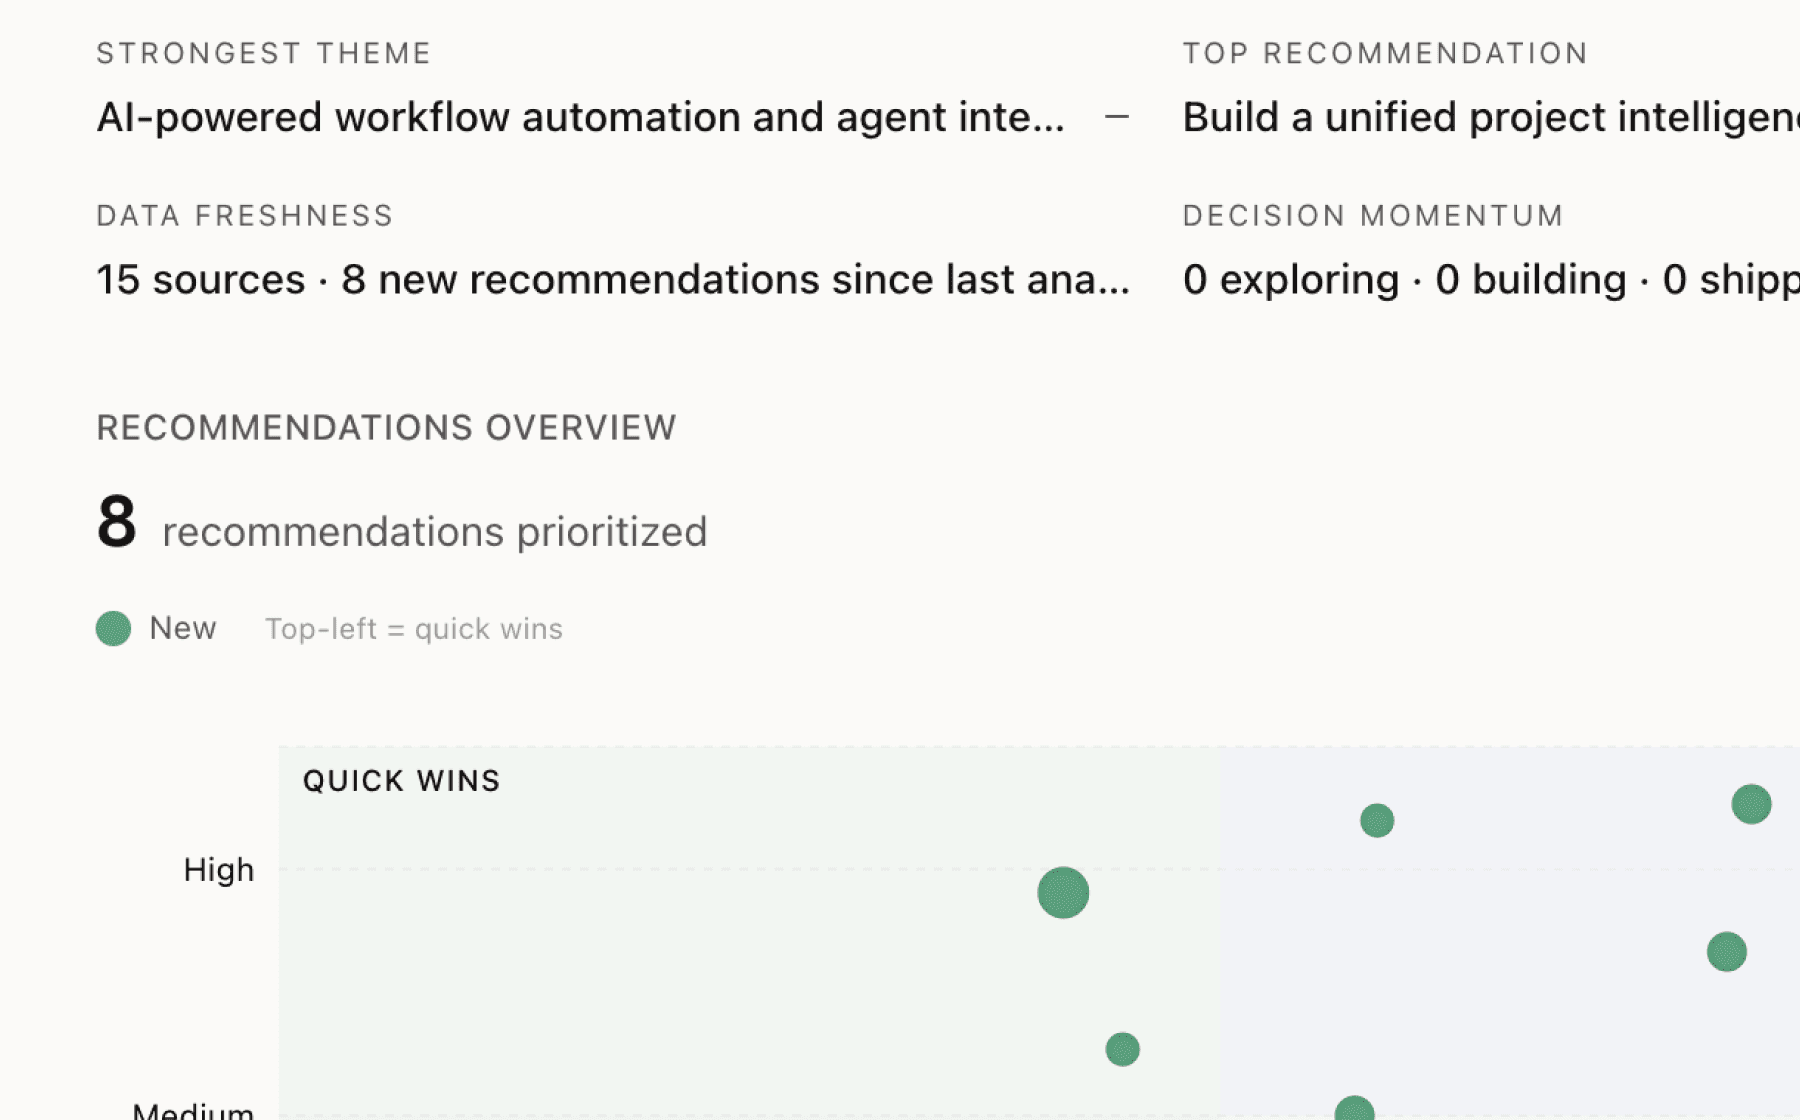
Top recommendation
AI-generated, ranked by impact and evidence strength
Build a real-time volatility dashboard that surfaces unquantified financial exposure by site and contract
High impact · Medium effort
Rationale
Four sources confirm that volatile power prices and curtailment threats create tens of millions in hidden risk premiums, yet current static contracting approaches leave buyers blind to their actual exposure. Enterprise teams managing scattered dashboards and spreadsheet models cannot quantify this risk in real time, leaving CFOs and procurement leads unable to defend procurement posture to the board or justify investments in flexibility.
A unified dashboard that aggregates telemetry, tariffs, contracts, and market prices into live exposure calculations would make the invisible visible. Show each site's exposure to price spikes, curtailment probability, and the dollar value at risk over the next 30 days. This transforms Condor from a recommendation engine into a risk management control tower.
This directly supports the core value proposition of helping customers understand precise power costs and navigate volatility. It also creates a compelling entry point for new customers: book a working session, plug in their contracts and telemetry, and immediately see millions in unquantified risk. The primary metric becomes concrete and measurable.
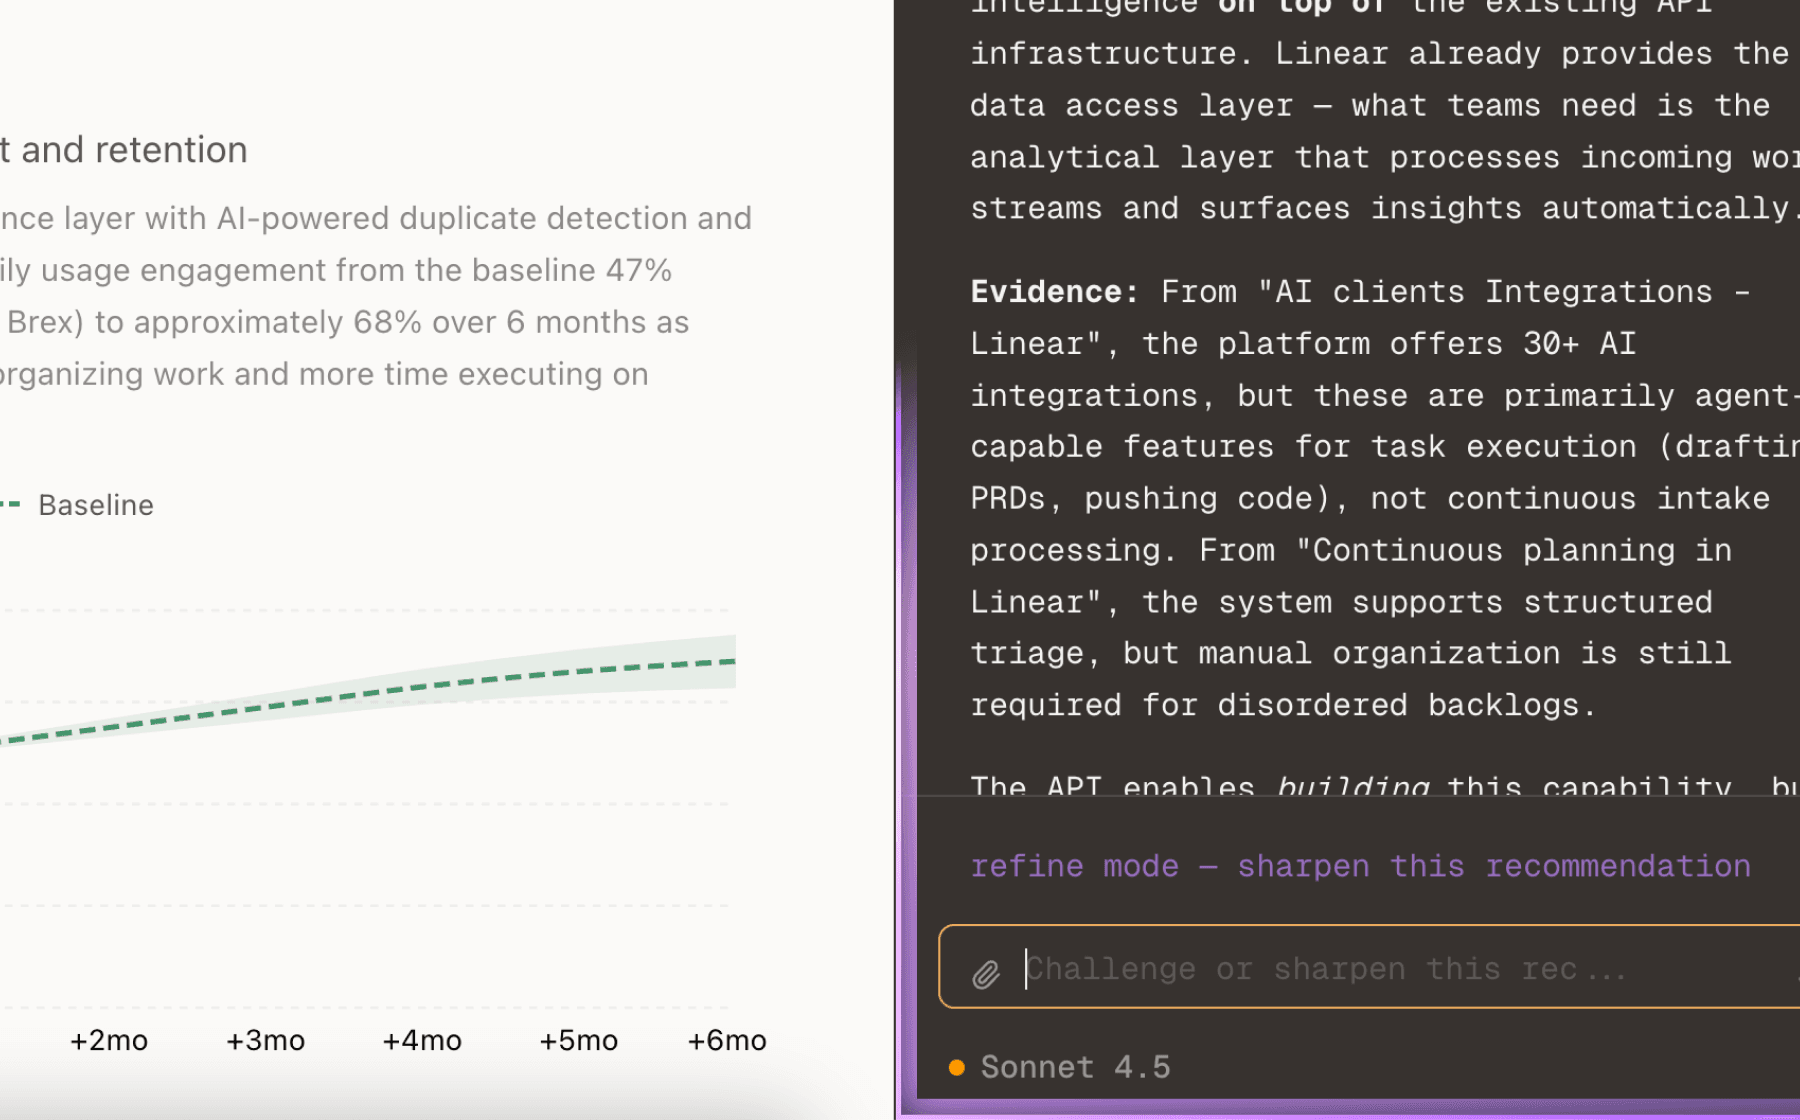
Projected impact
The full product behind this analysis
Mimir doesn't just analyze — it's a complete product management workflow from feedback to shipped feature.
Evidence-backed insights
Every insight traces back to real customer signals. No hunches, no guesses.
Chat with your data
Ask follow-up questions, refine recommendations, and capture business context through natural conversation.
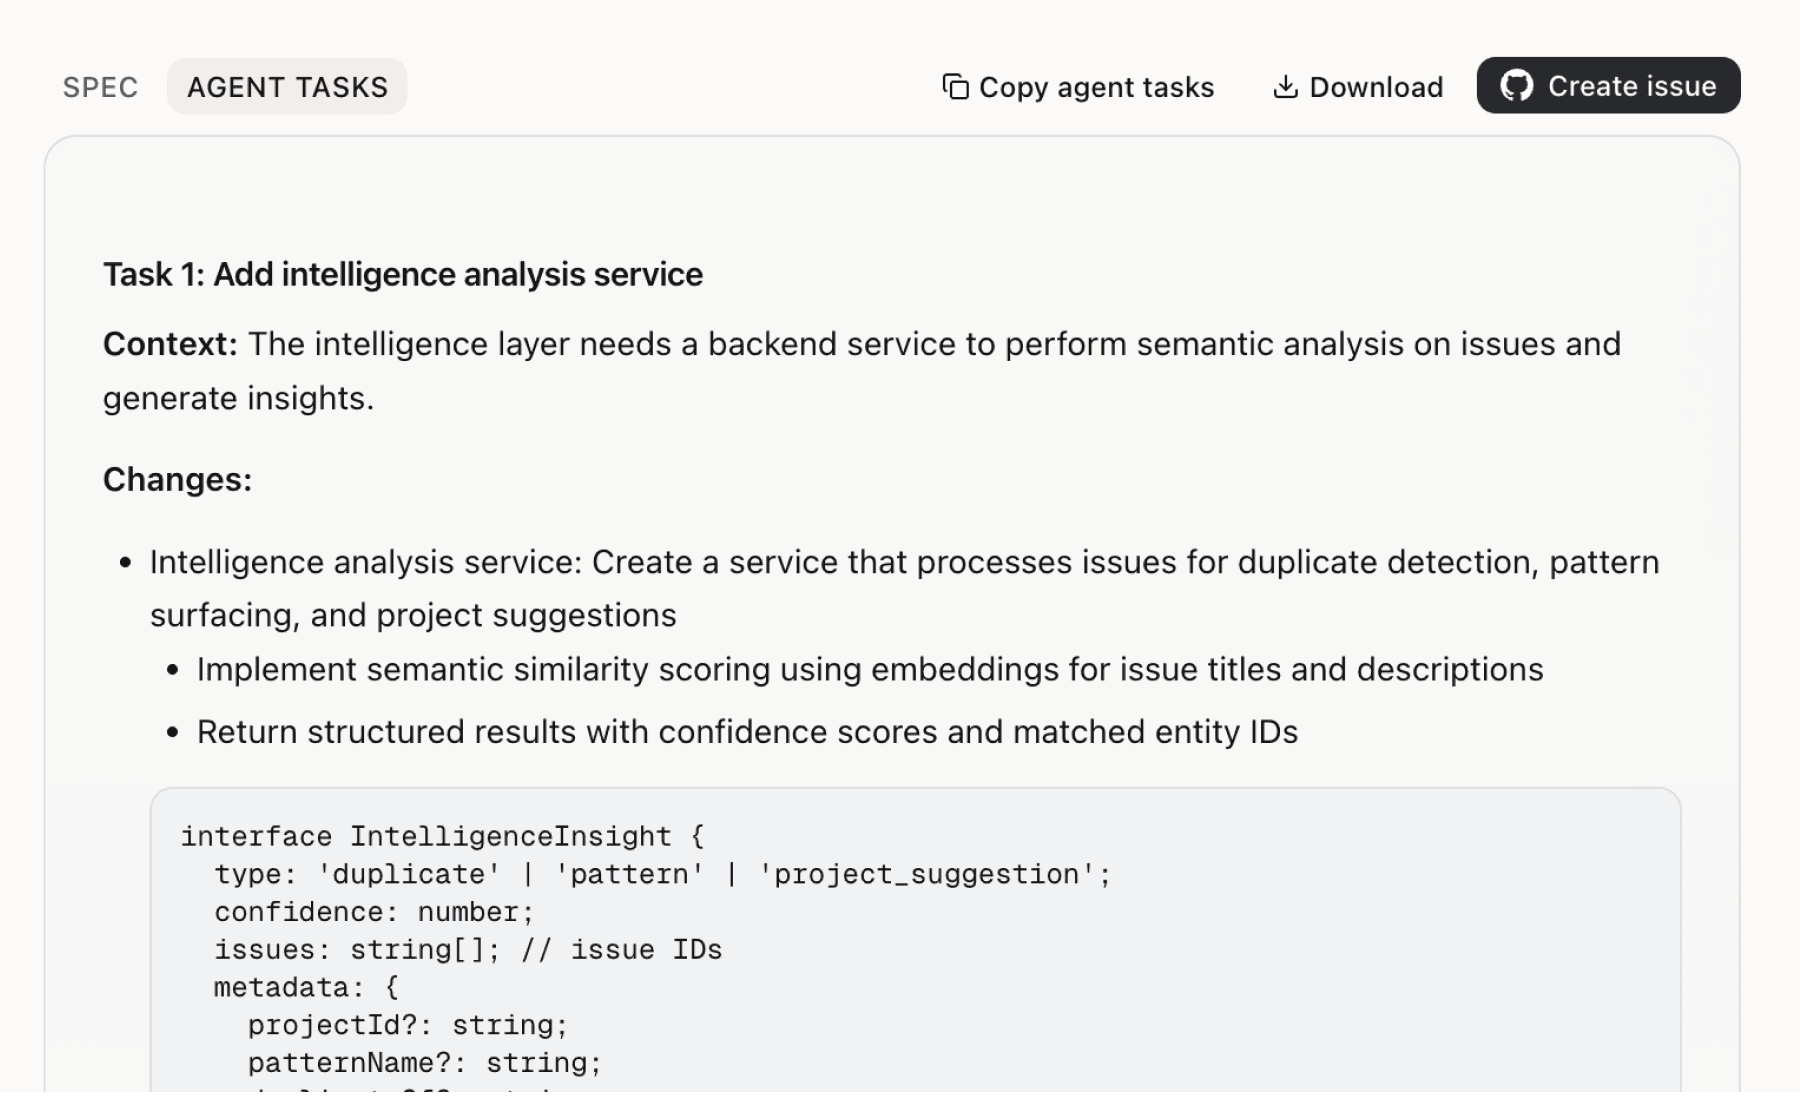
Specs your agents can ship
Go from insight to implementation spec to code-ready tasks in one click.
This analysis used public data only. Imagine what Mimir finds with your customer interviews and product analytics.
Try with your dataMore recommendations
5 additional recommendations generated from the same analysis
Curtailments are becoming baseline operational challenges, not edge cases. Four sources note that stressed-grid curtailments trigger expensive unplanned stoppages, yet buyers have no advance warning system to prepare mitigation plans. Current reactive posture means lost production, emergency diesel costs, and scrambled logistics.
Two sources confirm that Condor enables shiftable load activation without disruption, but current buyers lack visibility into which loads are actually flexible. A data center can shift cooling load during price spikes, but not critical compute. A manufacturer can delay batch processes, but not assembly lines. Without this operational transparency, flexibility remains theoretical.
Three sources note that large buyers still manage electricity through static contracts and spreadsheet approximations, leaving significant value on the table. When procurement teams negotiate with suppliers, they lack tools to quantify how much a demand response clause is worth, or whether a floating rate beats a fixed rate over 12 months given their load profile. This means accepting supplier proposals without rigorous analysis.
Three sources confirm that electricity has become a material competitive lever, yet buyers have no visibility into whether their procurement posture is world-class or lagging. A CFO cannot tell whether 12 cents per kWh is competitive for their industry and geography, or whether their curtailment exposure is within normal bounds. This information asymmetry prevents strategic investment in energy management.
Four sources note that Condor ranks moves by value and risk to enable fast execution, but there is no evidence that the system tracks whether recommendations were implemented or what results they delivered. Without this feedback loop, teams cannot prove ROI to finance, prioritize which types of moves work best, or learn from failed experiments. The product remains a suggestion engine rather than a closed-loop operating system.
Insights
Themes and patterns synthesized from customer feedback
Large buyers have untapped flexibility to shift or curtail discretionary load in response to price spikes or grid stress, but lack visibility into which loads can move without disrupting core operations. Enabling this flexibility requires integrating operational constraints with energy market signals in real time. Condor provides this capability by mapping which moves preserve operational integrity while capturing financial upside.
“Condor enables activation of shiftable load without disrupting core operations”
For data centers, industrial manufacturers, and large retailers, power costs and grid reliability now rank alongside traditional operational bottlenecks as strategic business constraints. Early movers who systematize energy procurement and operations can unlock measurable cost and risk advantages. Condor's positioning reflects this shift: electricity is no longer just an input cost to minimize—it is a source of competitive differentiation.
“Electricity is positioned as a new bottleneck for large enterprise buyers”
Electricity volatility and curtailment threats expose large buyers to tens of millions of dollars in hidden risk premiums and unplanned operational stoppages. Current static contracting approaches lack the flexibility to adapt to real-time grid stress and market conditions. Efficient energy management systems that rank interventions by value and risk can materially reduce these exposures.
“Power prices are volatile and curtailments are becoming the baseline operational challenge”
Large enterprise buyers currently rely on scattered dashboards, static spreadsheet models, and disconnected data sources to manage electricity exposure. This fragmentation prevents real-time decision-making and leaves significant value on the table. Condor consolidates site telemetry, tariffs, contracts, and market prices into a single unified model to enable fast, coordinated action.
“Enterprise energy procurement teams use scattered dashboards and static models instead of integrated systems”
Run this analysis on your own data
Upload feedback, interviews, or metrics. Get results like these in under 60 seconds.